5 Restoration Modes and Potential
A developer promises native grass under the panels and a flock to keep it down. Whether that promise is worth anything depends on which decision is carrying it. The grass could be there because the array went on the part of the field where the water already runs, because the rows were spaced wide enough to let light reach the ground, because a grazier was hired to seed it and bring the animals, because the farmer owns the array and the ewes both, or because the lease requires it for thirty years. The grass is the same in all five. What differs is who has to keep doing something, and what anyone could look at in year twenty to find out whether it held.
A project does not turn out restorative. Somebody decides which of those levers will carry that work and commits the design to it, early enough that the decision survives the last round of cost cutting. That choice is the project’s restoration mode, and it is the third thing this document puts on a project. Scale says what was available. The farming axis says what happened to production. The mode says which lever actually did the restoring, and of the three it is the one a designer chooses outright.
One thing to clear first, because this audience carries a different meaning already. In a solar lease or a siting filing, site restoration is a decommissioning obligation: what the developer owes the ground when the lease ends. A restoration mode is not that. It is a choice made at design, about which lever will carry restorative work through the operating life, and it is settled decades before anyone reads the decommissioning clause.
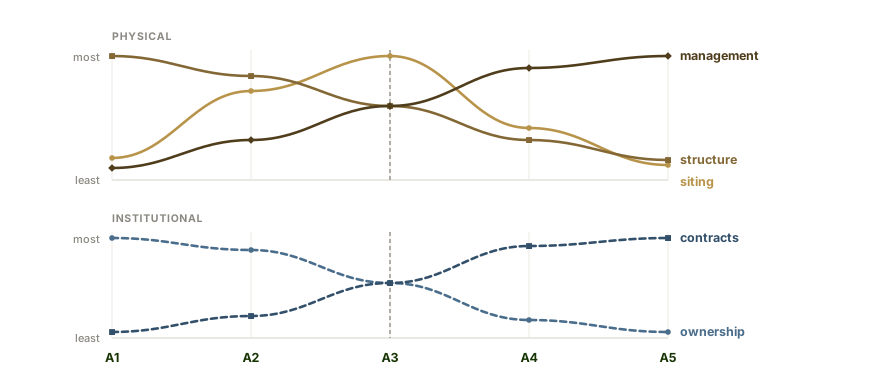
Every one of the six design levers is in play somewhere on the transect, and none holds the same range throughout. Some run out entirely at one end. The pattern is not a general loss of freedom as projects grow. Three levers act on the ground and trade against each other along the transect, two are institutional and run in opposite directions, and scale is the axis the other five are read against rather than a curve of its own.
5.1 The five modes
Five of the six design levers can be made to carry the work.
- Siting-led — put the array where the ground itself does the work. Solar prairie strips are the case: the planting goes where the runoff already goes.
- Structure-led — build the geometry to do it: clearance, row spacing, how much light the modules let through. Barnyard shelter is the case.
- Management-led — take placement as given and put the ground cover, the grazing regime, and the operational calendar to work. Regenerative solar grazing is the case.
- Ownership-led — structure the holding so that no agreement is required, because the interests were never opposed. Barnyard shelter is the case again, and for a second reason: the person who owns the array owns the animals standing under it.
- Contract-led — write it into the lease, the ordinance, or the benefit agreement rather than into anything on the site. The community and economic function runs on this one. Retired-irrigation solar is the case: siting the array retires the field, but only the water right, retired on paper, retires the pumping.
A mode is also what decides how a restorative claim can be checked. A siting-led claim is verified against a map, a structure-led claim against a drawing, a management-led claim against a maintenance schedule somebody has to keep for thirty years, a contract-led claim against a document that can be read, and an ownership-led claim against the deed and the operating agreement, which is the easiest of the five to check.
The last two share a panel of their own in Figure 5.1, and they are best read together. Ownership-led and contract-led are the same problem at two scales. An owner-operator needs nothing written down, because the party deciding and the party living with the decision are one person. A utility in another state needs everything written down, because they are not, and by A4 and A5 the owner is developer capital or a utility and the generation revenue has moved with them.
So the alignment ownership supplies for free at the farmstead has to be manufactured, clause by clause, as ownership moves up the transect. At A1 there is hardly a contract to write, for want of a counterparty. Through A3 the instruments arrive, as a PILOT, a subscription, a community-benefit agreement. By A5 the lease term, the maintenance obligation, and the benefit agreement are the only reach left. Contract-led restoration is what you need when ownership-led restoration is no longer available.
5.2 Scale controls restoration potential from each mode
The sixth lever sits outside that list, and the reason is worth stating plainly. Scale is not itself a restoration mode. It governs all the others. Choosing to build five megawatts rather than eighty is not a way of doing restorative work; it is what decides which of the five stay open to the design. How much range a lever still keeps at a given size is what decides whether it can carry the work at all.
That may not hold. If spillover turns out to scale with perimeter rather than with area, then several mid-sized arrays do ecological work one large array of the same capacity does not (§5.3), and choosing to build small and many is restorative work. Scale would earn a mode after all.
The lever the transect treats most sharply is siting latitude, the freedom to choose where the array goes. What is still open to a design, and what has already been settled for it, both change as projects get bigger.
| Zone | Restorative siting options | Key constraints |
|---|---|---|
| A1 | The yard and the paddock the stock already use | The property line, and the existing service drop |
| A2 | Spare corners, awkward field ends, ground already sitting idle | The operator’s own holding, and nothing beyond it |
| A3 | Consistently low-yielding ground, where the water runs, buffer geometry | Parcel size, and what the distribution line will take |
| A4–A5 | Little beyond the edges: setbacks, buffer planting, and what grows under the array | Contiguous acreage near a substation, a place in the queue, prime-farmland rules, and likely opposition |
Through A2 and A3 that latitude is the strongest instrument a design has, so the work there is siting-led: the planting goes where the runoff already goes, and the array goes on the part of the field that never performed. At A1 there is almost nothing to choose among, and by A4 and A5 the ground has been chosen by other forces entirely.
Structure runs the opposite way and peaks where siting is weakest, which is what makes the farmstead structure-led. At A1 an array is built to fit a particular yard, at a clearance the herd needs, out of whatever the local installer can source, because nothing about it has to be repeatable. Through the commercial and community zones the geometry answers to a crop. By A4 and A5 racking is a commodity bought by the megawatt, and the structural decision that still matters most is how much earth the system obliges anyone to move.
Management arrives last of the three. It barely exists at A1, where the work is done by hand alongside the rest of the farm, and it carries everything at A4 and A5, where seeding and grazing are contracted enterprises with a line of their own in the budget. That is what leaves the large end management-led: at utility scale restorative practice is mainly ground cover and grazing, and through the commercial and community zones it is mainly placement (Macknick et al. 2022; Randle-Boggis et al. 2020).
Both hand-offs fall in the same zone. Structure gives way to management among the physical levers, ownership gives way to contracts among the institutional ones, and siting latitude is at its widest over the top of both, the least well established of the three curves, which leaves A3 the only zone where every restorative instrument is live at once, a stronger claim than A3 merely having the widest siting latitude (§5.3). Below that zone a project restores by choosing its ground, by how it is built, and by who holds it. Above it, by how the place is run and by what the parties signed.
Read quickly, those curves say that restoration is a small-project business. Restoration does not fall away with scale. It changes tool. A developer handed that reading will scale back the ambition, when what needed changing was the lever. A 200 MW project cannot choose the ground it sits on in any meaningful sense, and it can still decide what grows there for thirty years, who holds the asset, and what the lease obliges anyone to do.
Those forces can be named. Across US utility-scale projects, siting tracks proximity to roads, transmission lines, and substations, together with higher population density, non-forested cover, and flatter terrain (Wu et al. 2026). None of those is a property of the ground that restoration cares about. A parcel is selected because a substation is close and the slope is mild, and whether it was leaching nitrate or carrying a wet depression enters the decision late or not at all. That is the mechanism behind the phrase assembly-driven, and it is why siting-led restoration works in the middle of the transect and runs out at the large end.
The economics point the same way. Greenfield land, prime agricultural ground above all, is the cheapest class to build on, while contaminated land carries a premium of 14 to 33% (Owusu-Obeng et al. 2025). The ground a restorative argument most wants taken is the ground a cost model most wants avoided, and the gap widens with project size, because a developer assembling several hundred contiguous acres has fewer candidate parcels and less appetite for a premium on any of them. Brightfields exist, and what stops them scaling is that premium together with how little such ground there is, not any limit on a given site.
5.3 The Community Scale (A3) Stands Out
Both hand-offs falling in one zone is the design argument for A3, and Figure 5.1 is where it is drawn. There is a second argument for the zone, and it is the one that decides whether restorative agrisolar matters beyond the field it is standing in.
Restorative work happens at the scale of a wet corner, a contour band, a flock. Those are effects measured in acres, and they accrue to a watershed, a flyway, a county. None of them lands in a single national account the way a megawatt does. Energy is the opposite. A megawatt is fungible, and the climate arithmetic only cares about the total. The community scale is the one place those two facts meet, because a project small enough for a developer and a landowner to walk the ground together is also a project that can be built thousands of times over. Every one of those builds restores its own ground locally, and the fleet adds to a number that shows up in a national energy account.
Nothing else on the transect does both. A farmstead array restores its own yard and will never total to anything nationally; a complex reaches the number and has already given up the choice of ground. The middle is the only zone where the restorative and the energetic case are the same case, and that is why this document keeps returning to it.
A parcel of forty or eighty acres is big enough that management arrives: someone is hired to seed it, a grazier turns up with a flock, and maintenance has a line of its own in the budget. It is also still small enough to place deliberately. A typical Midwestern crop field runs forty to eighty acres, so an A3 array fits inside one or two of them, which means it also fits inside one owner’s decision.
The zone tops out near 5 MW on an assumption, and the assumption is worth saying out loud: a restorative community-scale array takes at most about a third of its parcel, which on a forty to eighty acre field comes to roughly 2 to 4 MW. Policy lands on the same boundary independently, since Massachusetts, Minnesota, New York, and Maryland all cap at 5 MW and Berkeley Lab splits its national datasets there. That one-third assumption is load-bearing and has not been tested (§9.4). It governs only the positions where production stops, S3 through S5, because under primary agriculture coverage is not removal: an array spanning a vineyard covers the whole parcel and takes none of it.
The zone takes its name from what the trade already calls this band, community-scale solar, and the phrase carries at least four senses worth separating. Solar sized to a community’s load rather than to a wholesale market. Solar sited where communities already are, on the distribution grid. Solar whose benefits are structured to reach a community, through subscription, tax base, or local ownership. And solar that builds resilience, since a distributed fleet fails differently than one large plant. The restorative case for it is a fifth sense, and it is the one this document makes.
The capacity at stake is not a rounding error. NREL puts community solar technical potential at 967 GW-AC even under conservative siting assumptions, about sixty percent of the 1,600 GW-AC that DOE’s Solar Futures Study puts at 2050 need (Ardani et al. 2021), and the middle is not wasteful of the land it uses: plants between 1 and 20 MW took 5.9 acres per megawatt against 7.2 above 20 MW. Much of the band never reaches the headline national numbers at all, because conventional utility-scale potential studies apply a contiguity filter equivalent to omitting sites of 1.2 MW-AC or smaller.
What binds at A3 is money rather than land. The nearest published band sits just above the zone: projects between 5 and 20 MW came in at $2.19 per watt-AC in 2024 against $1.38 above 250 MW, a penalty of about thirty-seven percent, and the fixed-cost logic implies the penalty is larger still below 5 MW, where nobody reports it. The reason is that the paperwork does not scale down: a 2 MW project needs much the same letter of intent, EPC agreement, and power purchase agreement as a 200 MW one, and its offtaker is likelier to lack a credit rating. The zone with the most design freedom has the least access to capital, which is why A3 is under-built against what it could do. That is a finance problem, not a verdict on the zone.
Where the restoration lands is a matter of geometry, and the pollinator evidence comes from arrays in this band. Two Minnesota sites at the top of this band produced bee visitation to soybean fifteen meters outside the fence at roughly two and a half times the rate inside the crop, with the effect bounded at half a kilometre to a kilometre and a half (Walston et al. 2018, 2024). A benefit delivered at that range scales with perimeter and proximity rather than with area, which is a mechanical argument for many mid-sized arrays over a few large ones, and the ecological literature has posed that question without answering it (Tölgyesi et al. 2023).
5.4 Reducing harm and promoting benefit
Restoration covers two jobs that have less to do with each other than the word suggests.
Stopping a harm ends something the ground was doing to somewhere else. Retire a field that was sending nitrate down its tile line and the nitrate stops; take a wet corner out of the rotation and the tillage stops with it. What gets claimed is a year that never happened, the one where the corn went in again, and the claim is capped by however much damage was already running. Ground that was not leaching cannot stop leaching.
Starting a benefit puts something on the ground that was not there before: native grass where there was bare fallow, roots deep enough to hold a hard rain where the crop was corn, shade the flock never had. Anyone can drive out in July and see whether it took, and the ceiling is whatever the site can grow. Permitting has sorted work in this order for decades, avoiding and minimizing harm first and repairing what is left afterward, and restorative design puts doing less harm a rung below putting something back (Reed 2007).
Every position on the farming axis answers a question about harm: whether a farm is still taking something off the ground, and whether it is the use that was there before (S1) or a lesser one (S2), whether the farm business survived losing the field (S3), whether the ground taken was already idle (S4), whether it was carrying a burden worth ending (S5). None of the five positions says anything about what the ground goes on to do. A project can sit at S5, the strongest answer that axis has, and still run gravel and a herbicide schedule under the panels for thirty years, while an ordinary S3 conversion delivers every one of the four restorative functions. Describing a project takes both readings. The one position outside that pattern is S0, which records a use that began rather than a use displaced, and so belongs on this side of the split rather than the other.
The two jobs often want different ground, which water shows plainly (§6.1). To stop the nitrogen at its source the array goes on the field that was leaking, because the cropping stops with it. To catch what is already moving it goes on the flow path below, which may sit on somebody else’s farm. Same objective, opposite pieces of ground.