5 Restorative Work
A developer promises native grass under the panels and a flock to keep it down. Whether that promise is worth anything depends on which decision is carrying it. The array might have gone on the part of the field where the water already runs. The rows might be spaced wide enough to let light reach the ground. A grazier might have been hired to seed it and bring the animals. The farmer might own both the array and the ewes. The lease might require it for thirty years. Or the array might be one of twenty small ones, so the grass sits within a bee’s flight of the fields around it. The grass is the same in all six. What differs is who has to keep doing something, and what anyone could look at in year twenty to find out whether it held.
Design levers do both design work, setting the form of the array, and restorative work, setting its impact. Chapter 1 read the levers for their design work, and this chapter reads them for their restorative work. All six do some of it. A design commits one of them to lead, early enough that the commitment survives the last round of cost cutting. The lead names the project: a siting-led array, a management-led one. The lead is the third way this lexicon describes a project. Scale says how big the array is and the farming axis says what happened to farming. The lead says which choice the restoration depends on, and of the three it is the only one a designer chooses outright. None of this has to do with site restoration in a lease, which means what a developer owes the ground when the array comes out.
5.1 The six leads
Table 5.1, at the end of the chapter, sets out what carries the work under each lead, what a claim is checked against, and the clearest case.
Scale leads by keeping the array small, and its work happens at the edge. At two Minnesota solar sites of 4 and 5.5 megawatts, bees visited soybean flowers within fifteen meters of the planted habitat at about two and a half times the rate a hundred meters or more into the field (Walston et al. 2024). A small array’s planting sits close to the fields around it, while habitat deep inside a large array may do less for its neighbors. Twenty small arrays also put a lease on twenty farms, where one large array puts it on a few. Water is the exception. Where an array sits on the flow path usually matters more than how big it is, so its water work is led by siting. Region shifts the leads as well. Where crops run on rain, water work is siting-led, on the flow path. Where they run on a pump, it is contract-led, because only a retired water right keeps the water in the aquifer.
A scale-led claim works differently from the other five. It is a comparison: the same megawatts, divided. A small array earns it only against the same power built as one block, and only if something at its edge is worth reaching the neighbors. A small gravel lot spreads nothing. The lead is often chosen by a program rather than a developer, when a state’s community-solar rules cap how big each project can be. It is strongest at A2 and A3, where someone can still choose to keep an array small. At the farmstead the size is set by the farm’s own load, and at A5 the size is the point. It is also the least tested of the six, since nobody has yet compared several small arrays with one large one of the same capacity (§10).
Any restorative claim can rest on three different things, and they are worth keeping apart: what a project intended, what its design or agreements secure, and what monitoring has measured. The third column of Table 5.1 says where to look for the second. The third takes someone going out to measure, and at most projects nobody has.
5.2 Scale decides which levers can lead
Scale’s second job is larger than its first. How big the array is decides which of the other five levers can still lead.
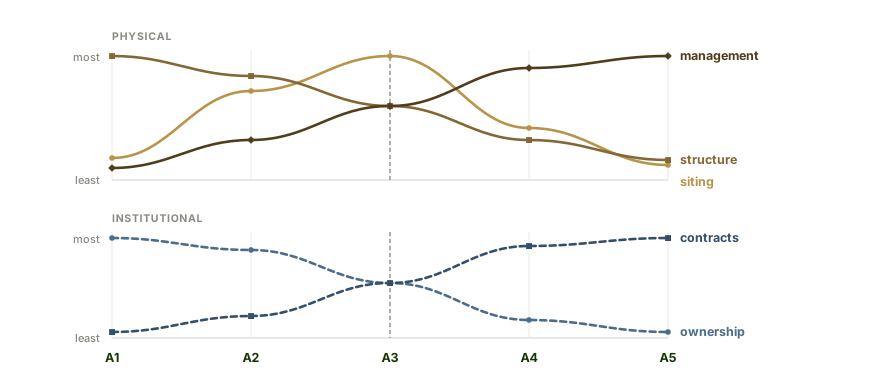
The three physical levers trade places along the transect. Structure is strongest at the farmstead, where an array is built to fit one yard at the clearance the herd needs. Siting latitude, the freedom to choose where the array goes, peaks at A2 and A3, where a developer and a landowner can still pick the wet corner or the ground that never yielded. Management carries most of the work at A4 and A5, where seeding and grazing are hired businesses with their own line in the budget. The two institutional levers run in opposite directions. Ownership-led and contract-led are the same problem at two sizes. An owner-operator needs little written down, because the person deciding and the person living with the decision are the same. A utility in another state needs nearly everything written down. Table 5.2, at the end of the chapter, shows what a design can still choose about its ground at each zone, and who chooses.
Read quickly, the curves seem to say that restoration is only for small projects. Restoration does not fall away as projects grow. It changes tools. A 200 MW project usually has little choice about the ground it sits on, but it can still decide what grows there for thirty years, who owns the array, and what the lease requires.
5.3 Why the community scale stands out
Both hand-offs happen at A3: structure gives way to management, and ownership gives way to contracts, with siting latitude at its widest right above both. Read this way, A3 is the one zone where every restorative tool is still within reach. Choosing A3 is itself scale-led work, and it keeps siting and ownership within reach. A parcel of forty or eighty acres is big enough for someone to be hired to seed it and a grazier to bring a flock, and small enough to fit inside one owner’s decision. It is also where local restoration can add up to a national number, because a project small enough to walk together can be built thousands of times over. NREL puts the technical potential for community solar at 967 GW under conservative assumptions, about sixty percent of the solar a decarbonized 2050 grid would need (Waechter et al. 2024; Ardani et al. 2021). The limit is money, not land. Projects of 5 to 20 MW cost $2.19 per watt in 2024 against $1.38 above 250 MW, about 59% more, because the paperwork does not shrink with the project. The case is strongest where a state’s community-solar program gives mid-sized projects a buyer. The evidence that A3 restores more than other zones is still thin (§10), so the case for it is a proposal to test.
5.4 The six leads in detail
| Led by | The work is carried by | A claim is checked against | The clearest case |
|---|---|---|---|
| Scale-led | keeping each footprint small, so what the array does reaches past its fence and lands on many hosts | the acreage inside each fence, how near it sits to other fields, and how many landowners host one | Pollinator Meadow Solar: community-solar gardens small enough that the whole meadow is within a bee’s flight of a field |
| Siting-led | where the array goes, so the ground itself does the work | a map | Solar Prairie Strips: the planting goes where the runoff already goes |
| Structure-led | the geometry: clearance, row spacing, how much light gets through | a drawing | Perennial Crop Canopy: panels ride above a planting whose life matches the array’s |
| Management-led | the ground cover, the grazing plan, and the yearly calendar | a maintenance schedule somebody keeps for thirty years | Regenerative Solar Grazing |
| Ownership-led | who owns it, so that little has to be agreed | the deed and the operating agreement | Barnyard Shelter Solar: the person who owns the array owns the animals under it |
| Contract-led | the lease, the ordinance, or the benefit agreement | a document anyone can read | Retired-Irrigation Solar: only the water right, retired on paper, retires the pumping |
5.5 Siting latitude in detail
| Zone | What a design can still choose | What has already decided it | Who does the choosing |
|---|---|---|---|
| A1 | The yard and the paddock the stock already use | The property line and the existing service drop | The operator, with almost no ground to choose among |
| A2 | Spare corners, awkward field ends, ground already sitting idle | The operator’s own holding, and nothing beyond it | The operator |
| A3 | Consistently low-yielding ground, where the water runs, buffer geometry | Parcel size, and what the distribution line will take | Developer and landowner, together |
| A4–A5 | Little beyond the edges: setbacks, buffer planting, and what grows under the array | Contiguous acreage near a substation, a place in the queue, prime-farmland rules, and likely opposition | The land market and the grid, with state and local rules able to veto the result |
Go deeper
- The A3 ceiling
The 5 MW limit rests on an untested assumption that an array covers at most a third of its parcel. - Low-yielding ground in prime fields
In 338 Midwest fields, 32% of the ground yielded poorly year after year. - Siting costs
In the eastern US, prime farmland is the cheapest ground for solar, and contaminated land costs 14 to 33% more. - Incentive bonuses
No one has checked whether state bonuses for farming or pollinator habitat changed what got built.